Analytics & Report Builder
Build the report your boss asked for — before the meeting ends.
Custom reports and dashboards over your live asset data. Filter, group, chart, and publish — without exporting a single spreadsheet.
Start Building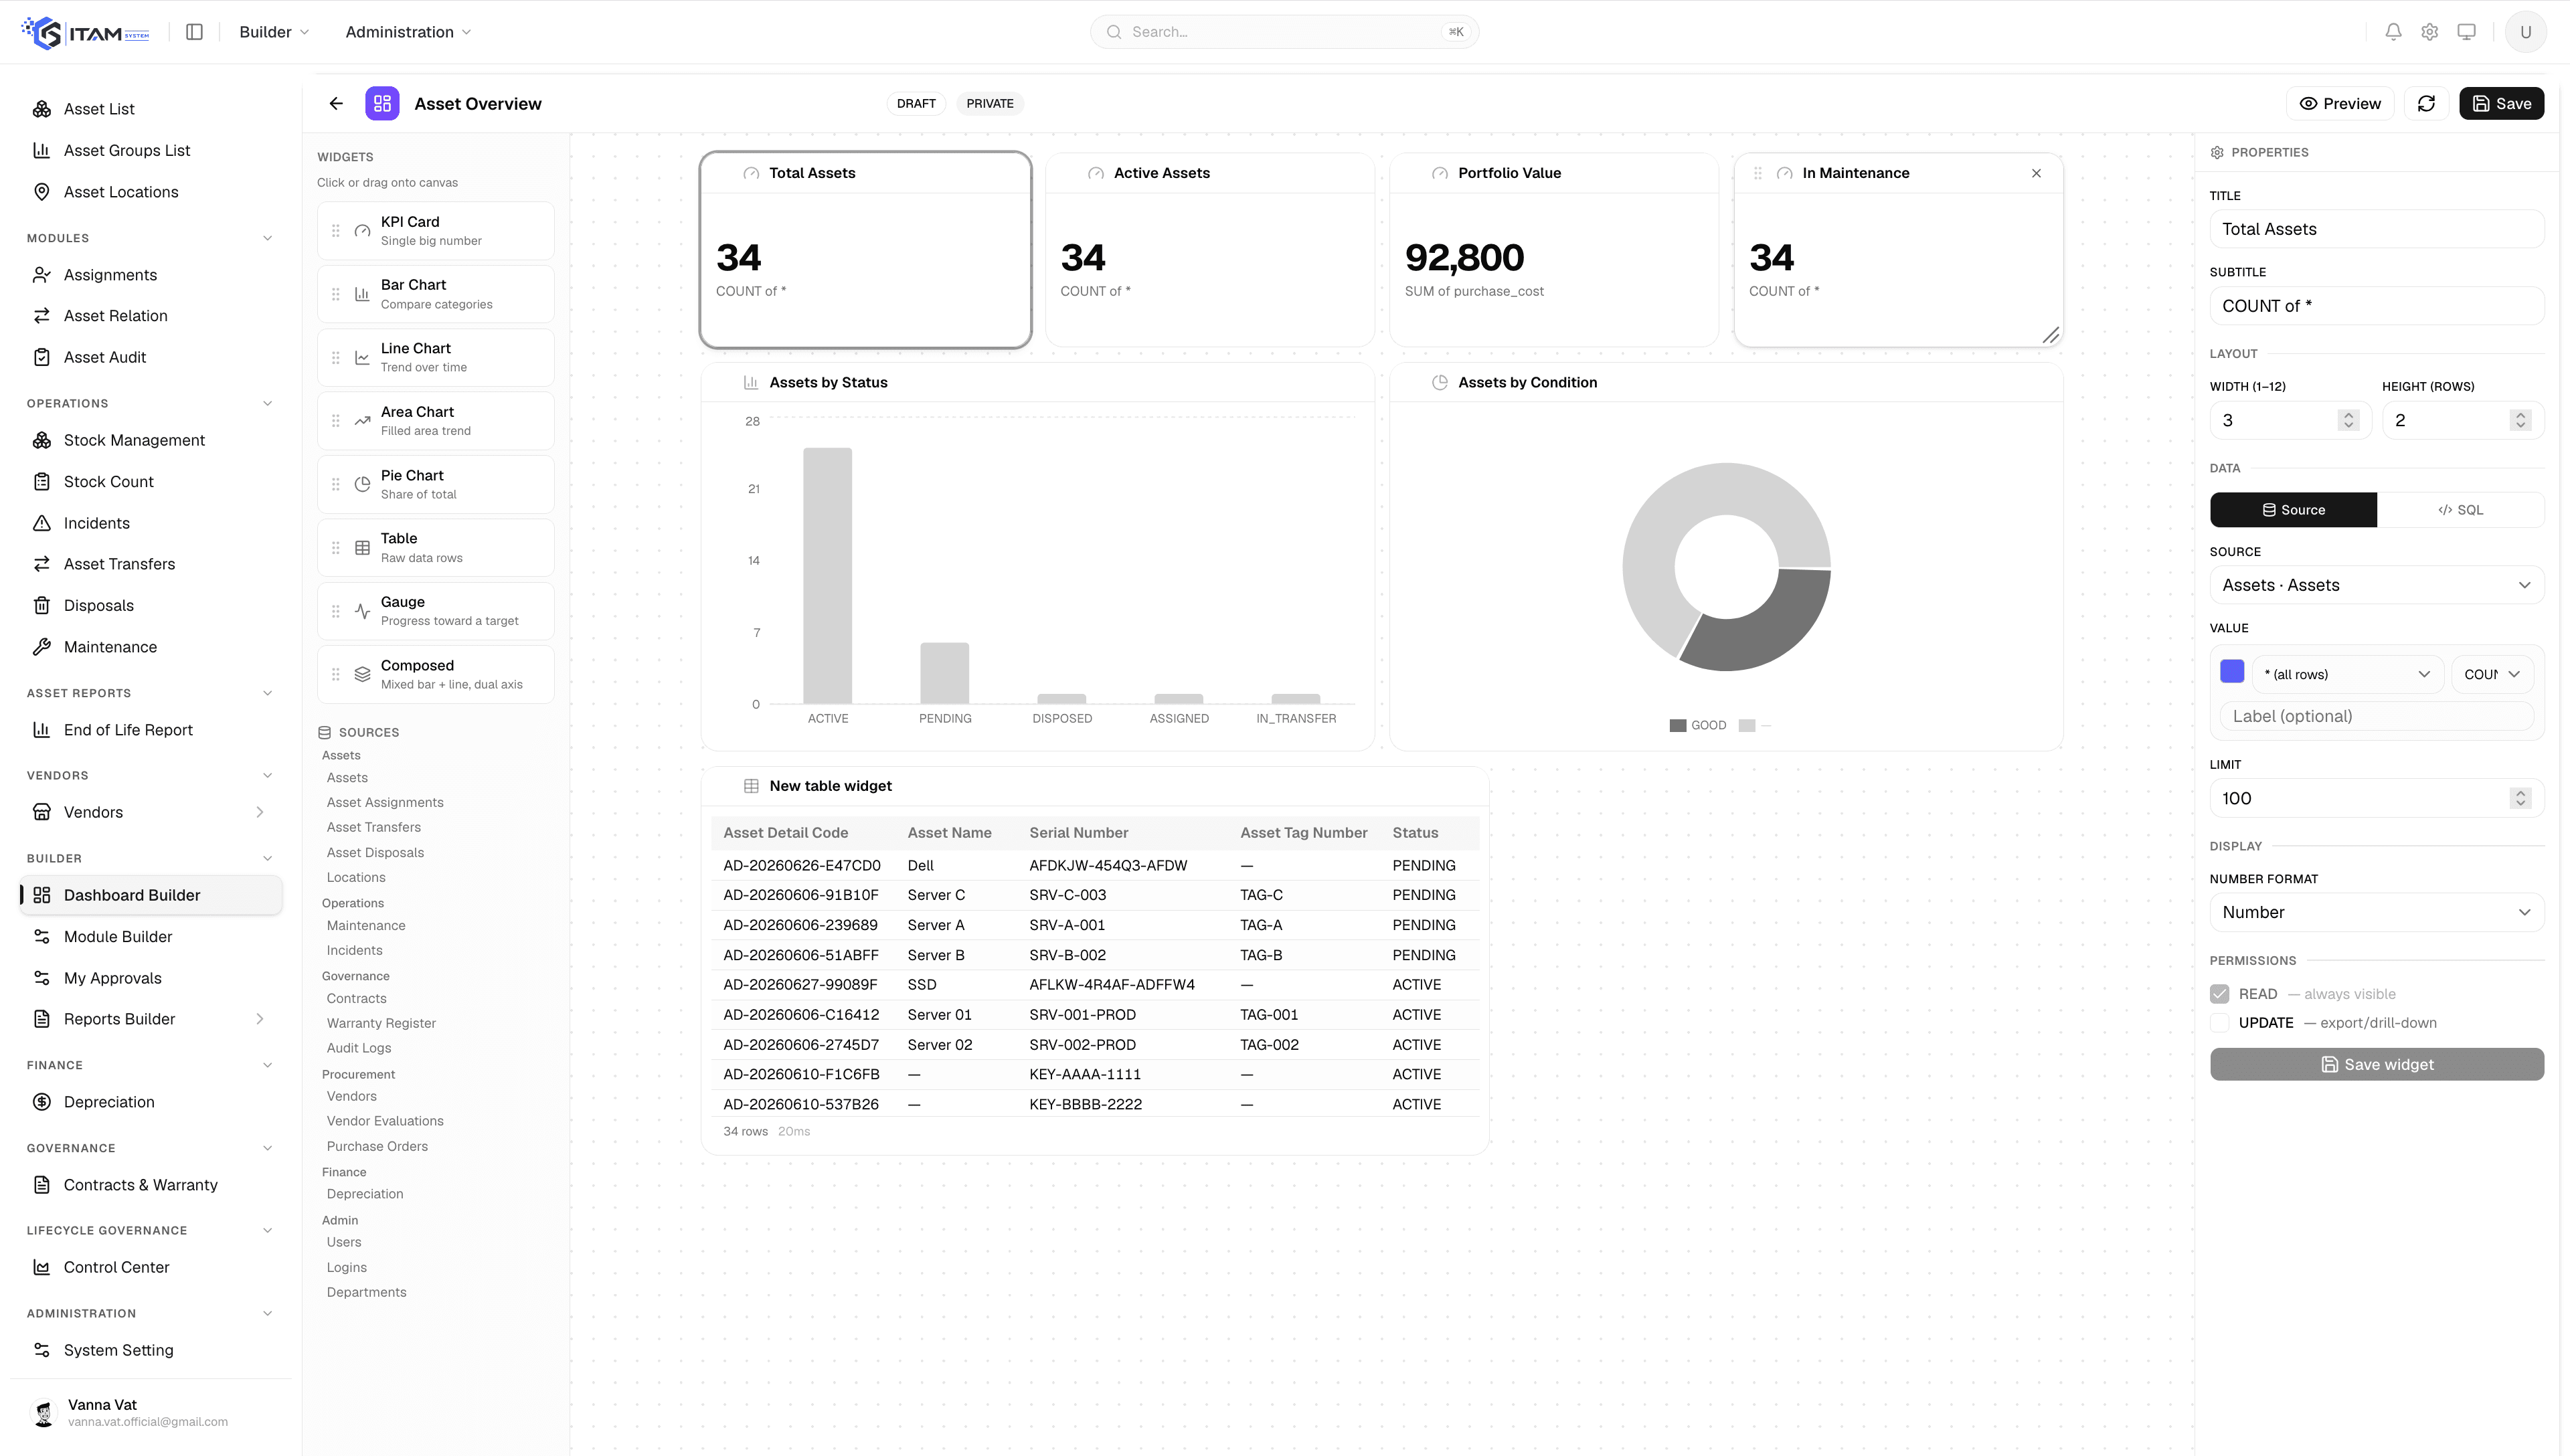
Drag-and-drop reports
Pick columns, filters, and grouping — no SQL, no export-to-Excel gymnastics.
Publish as modules
Turn any report into a sidebar module your team opens like a page.
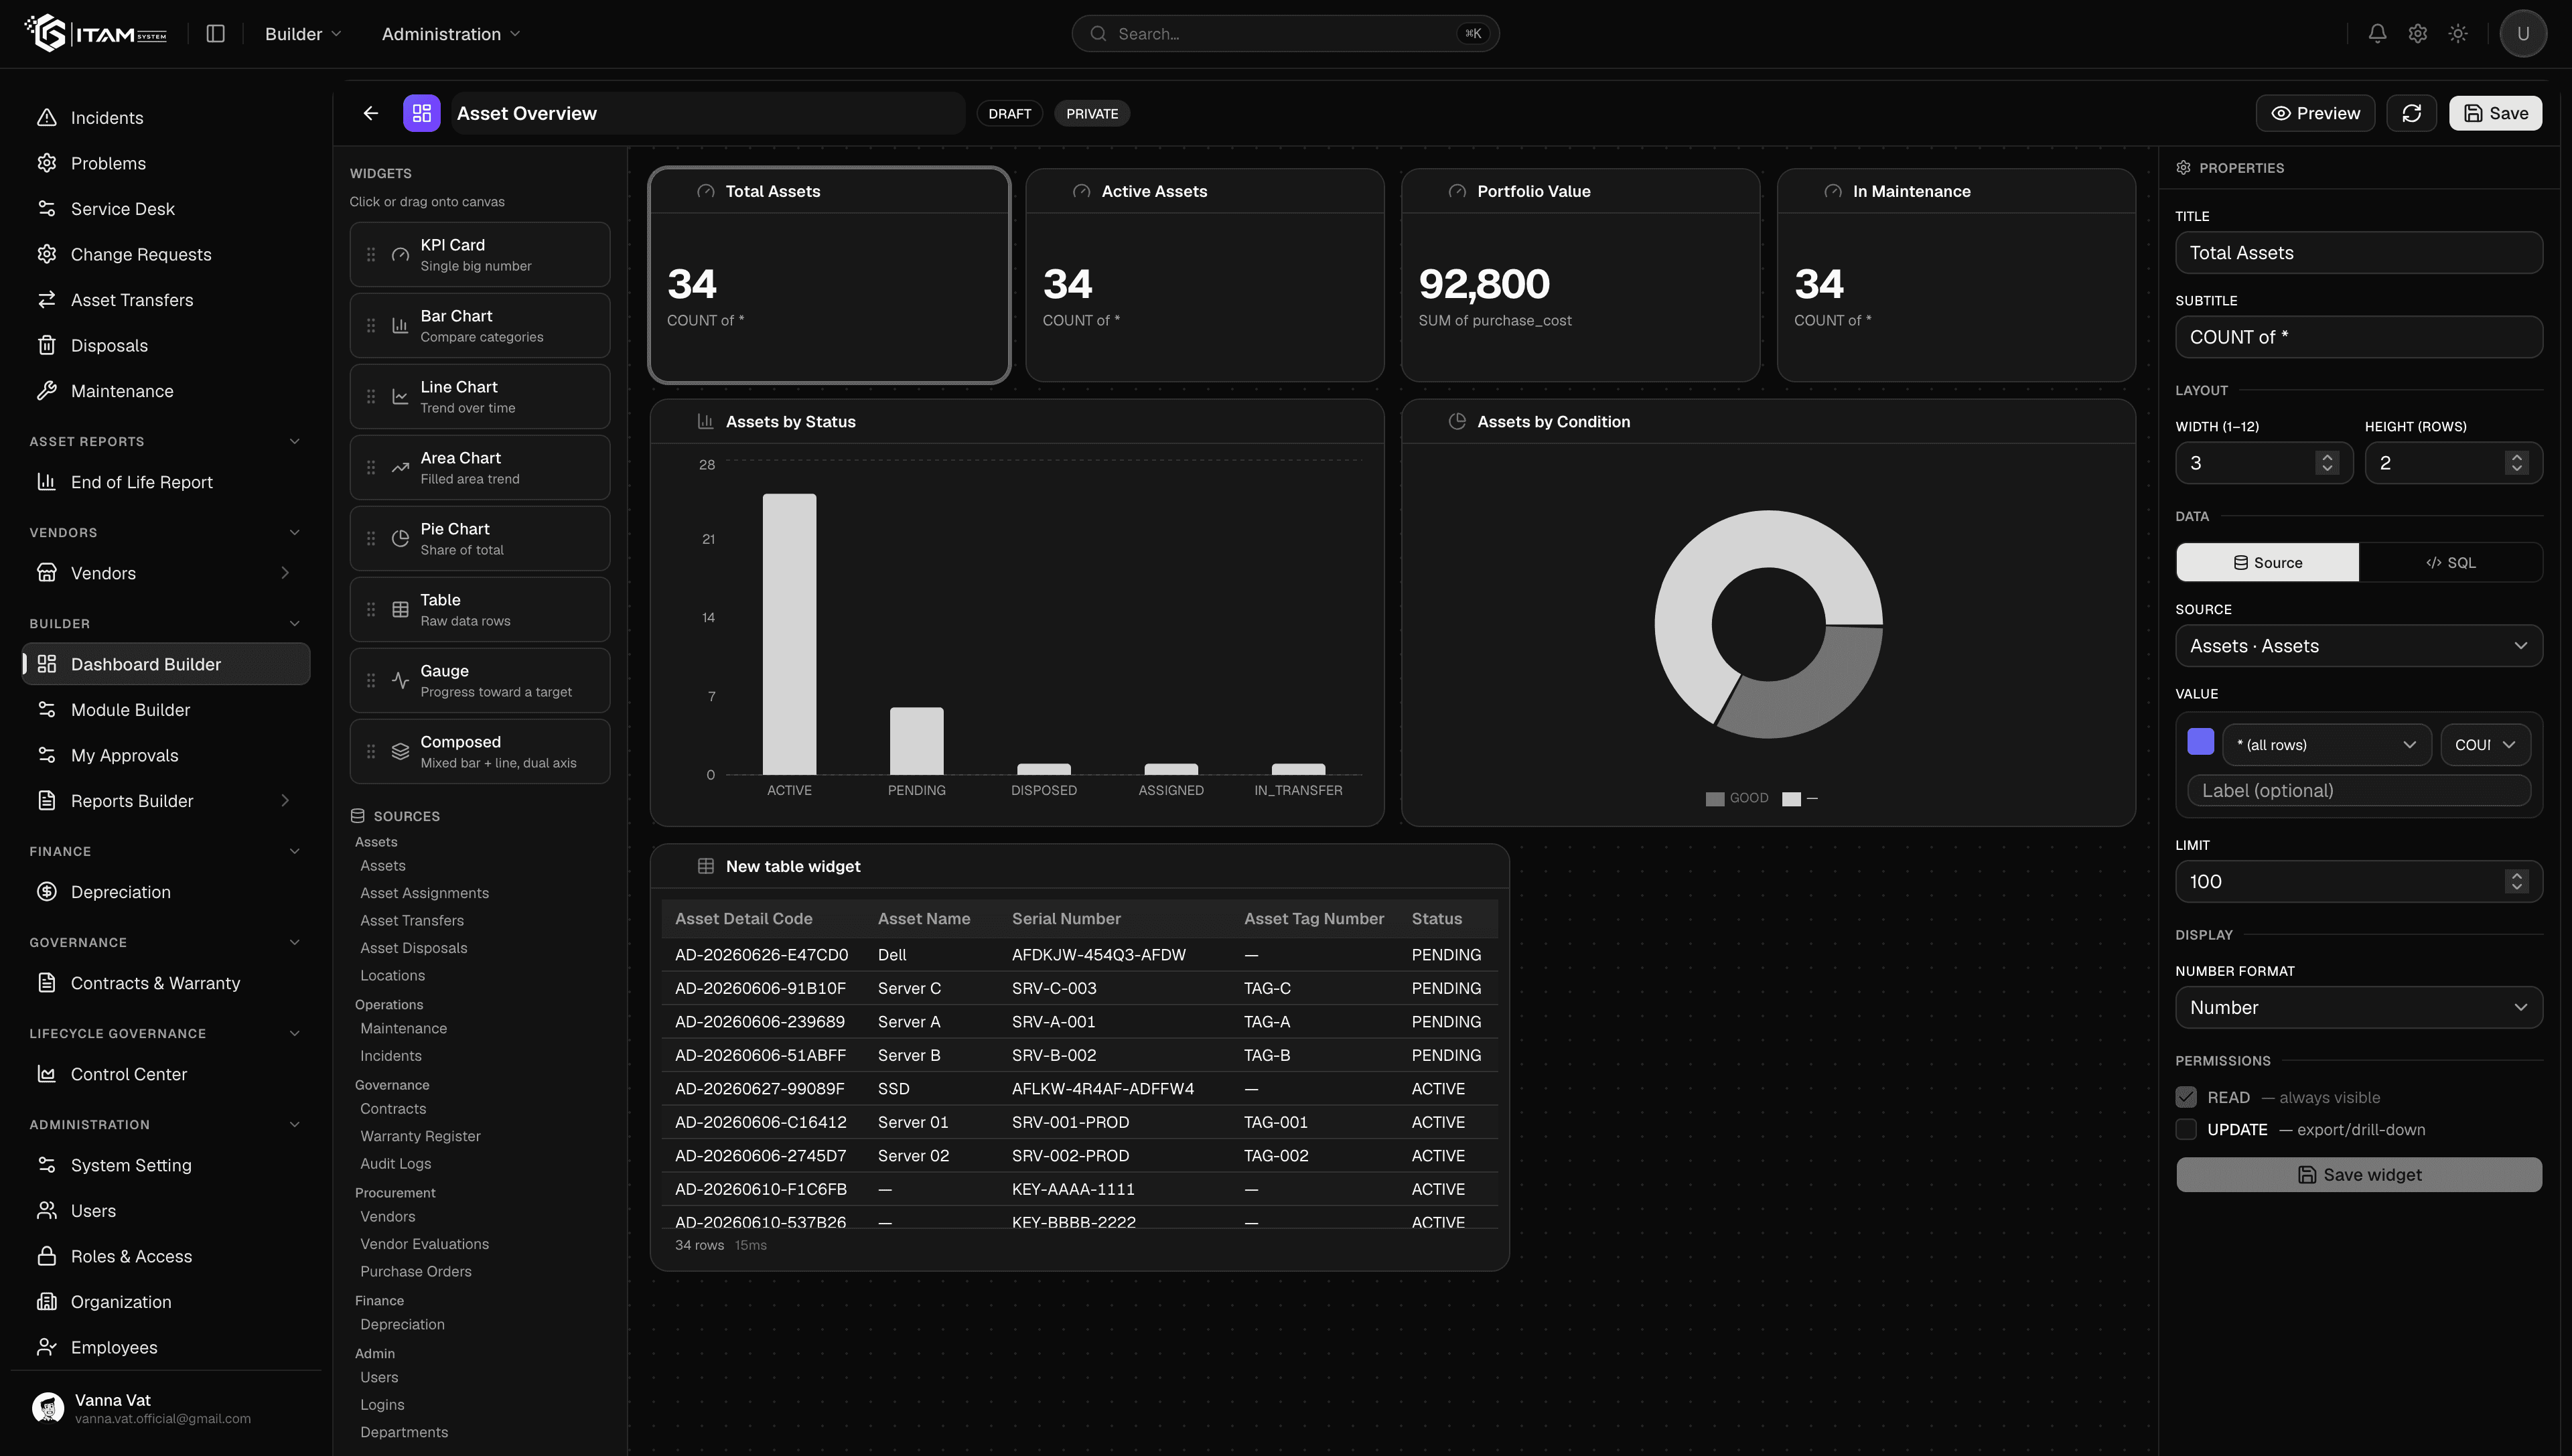
Dashboard builder
Compose KPIs, charts, and tables into dashboards for every team.
Live data
Reports read the same data your team edits — never a stale snapshot.
50+
Report columns
1-click
Publish to sidebar
Live
Always current
0 SQL
Required